Standby and Deliver: Ranking Smart Home Devices by Their Hidden Energy Toll
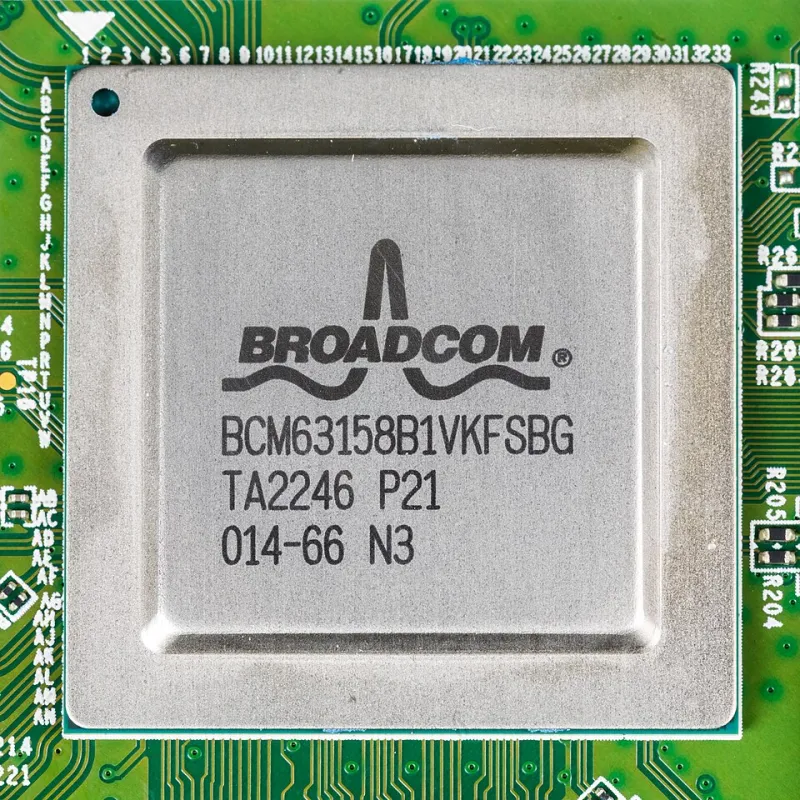
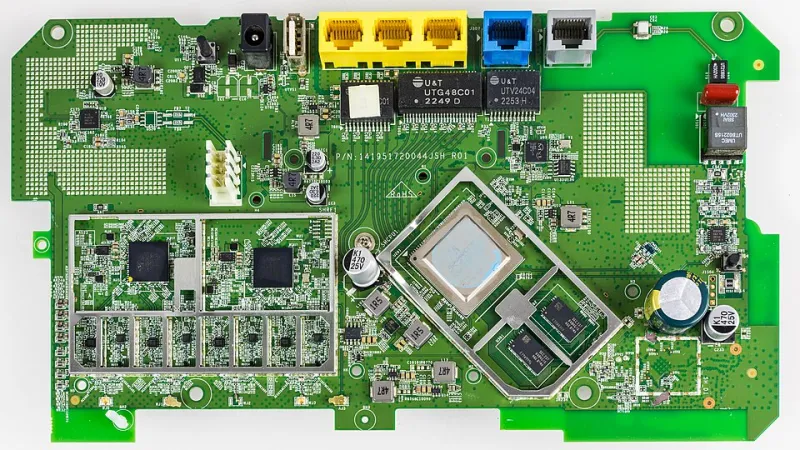
Photo: Raimond Spekking, CC BY-SA 4.0, via Wikimedia Commons
The marketing language around smart home technology has long leaned on the promise of efficiency. Automated thermostats, connected lighting, and intelligent power strips are routinely sold as instruments of conservation. The implication is straightforward: smarter homes use less electricity. The metered reality, however, is considerably more nuanced.
When a device is described as "smart," it is, by definition, always listening, always connected, and always drawing current — even when it appears to be doing nothing. That baseline consumption, commonly referred to as phantom load or standby power, accumulates silently across dozens of devices in the average American household. Individually, each draw may seem negligible. Collectively, they represent a measurable and often overlooked component of residential grid demand.
This analysis ranks twelve of the most commonly deployed smart home devices by their standby wattage and projects their annual electricity cost at the current U.S. residential average rate of approximately $0.16 per kilowatt-hour, as reported by the U.S. Energy Information Administration.
The Measurement Framework
Standby power figures cited here are drawn from published laboratory testing by the Lawrence Berkeley National Laboratory's Home Energy Saver program, supplemented by third-party metering data collected using calibrated smart plugs capable of measuring loads as low as 0.1 watts. Devices were assessed in their default out-of-box configurations, as that represents the condition in which the majority of U.S. consumers operate them.
Annual cost projections assume continuous standby operation — 8,760 hours per year — which is standard practice for devices that lack a true mechanical off switch.
Tier One: The Chronic Offenders
At the top of the phantom load rankings sit devices whose standby consumption rivals their active draw. Smart televisions measure among the worst offenders, with standby consumption ranging from 0.5 watts to as high as 2.8 watts depending on manufacturer and model year. A mid-range 65-inch smart TV left in standby mode can cost a household between $0.70 and $3.92 annually in idle electricity alone — a figure that compounds when multiple sets occupy the same home.
Smart speakers and voice assistants present a more complex picture. Devices such as the Amazon Echo and Google Nest Audio operate in a perpetual state of microphone-active listening, drawing between 1.5 and 3.5 watts continuously. Unlike a television in standby, these devices are functionally active at all times. At 3 watts continuous, a single smart speaker contributes approximately $4.20 to annual electricity costs before a single command is ever issued.
Video doorbells round out the top tier, with always-on Wi-Fi connectivity and intermittent infrared sensors pushing standby draws to between 2 and 5 watts. A Ring or Nest doorbell operating at 3 watts standby accumulates roughly $4.20 per year in phantom load — a figure that should factor into any homeowner's cost-benefit calculation.
Tier Two: Moderate but Manageable
Several device categories fall into a middle band where standby consumption is real but more easily justified by functional return. Smart thermostats, for instance, draw between 1 and 2 watts at rest. At $1.40 to $2.80 annually, this cost is routinely offset by the scheduling and remote-access capabilities that reduce HVAC runtime — provided the household actually configures and uses those features.
Smart plugs and outlet modules themselves draw between 0.3 and 1.2 watts while idle. This creates a somewhat circular inefficiency: a device designed to monitor or control energy consumption is itself consuming energy to do so. Whether that overhead is justified depends entirely on what load the plug is managing and how actively the user engages with the associated data.
Connected LED light bulbs in standby — that is, powered but switched off via app — draw between 0.2 and 0.5 watts per bulb. In a household deploying twenty smart bulbs, this contributes up to 10 watts of continuous phantom load, translating to roughly $14 per year in electricity consumed by lights that are, by every visible measure, turned off.
Tier Three: Low Impact, High Return
Not all smart devices perform poorly in this analysis. Smart power strips with energy monitoring — particularly those featuring master-controlled outlets that cut power to peripheral devices when a primary device enters standby — demonstrate genuine load reduction capability. When properly configured, these strips can eliminate three to five watts of phantom load per entertainment center, generating net savings that exceed their own standby overhead within a matter of months.
Smart water heater controllers and connected EV charging timers occupy a different category entirely. Their own standby draws are minimal (typically under 1 watt), and their primary function is demand-shifting — moving high-wattage consumption events to off-peak hours. For households in utility territories with time-of-use pricing, the financial and grid-stability benefits of these devices are measurable and significant.
What the Rankings Reveal
The data supports a conclusion that may frustrate device manufacturers but should inform purchasing decisions: the intelligence embedded in a smart home product does not automatically translate to energy intelligence. A connected device that provides no meaningful load management, no scheduling, and no behavioral feedback is, from a grid perspective, simply an additional draw — one that operates at all hours regardless of occupancy, demand, or rate conditions.
The household that installs twelve smart devices without auditing their standby profiles may be adding between 15 and 40 watts of permanent baseline load to its grid footprint. Over a year, that range represents $21 to $56 in electricity consumed by devices in a state of nominal inactivity.
The Actionable Standard
Ampergram's position is not that smart home technology lacks value. It is that value must be measured, not assumed. Consumers evaluating connected devices should request or independently verify standby wattage specifications before purchase. Devices that cannot demonstrate a net energy benefit — either through direct load reduction or verified demand-shifting behavior — should be assessed as convenience products rather than efficiency investments.
For households already committed to a smart home ecosystem, deploying a whole-home energy monitor alongside a circuit-level metering solution provides the data layer necessary to identify which devices are earning their grid real estate and which are simply occupying it. In an era when residential electricity demand is under increasing scrutiny from both utilities and regulators, that distinction carries real financial and systemic weight.