Always On, Always Charging: How to Measure the Invisible Electricity Drain in Your Smart Home
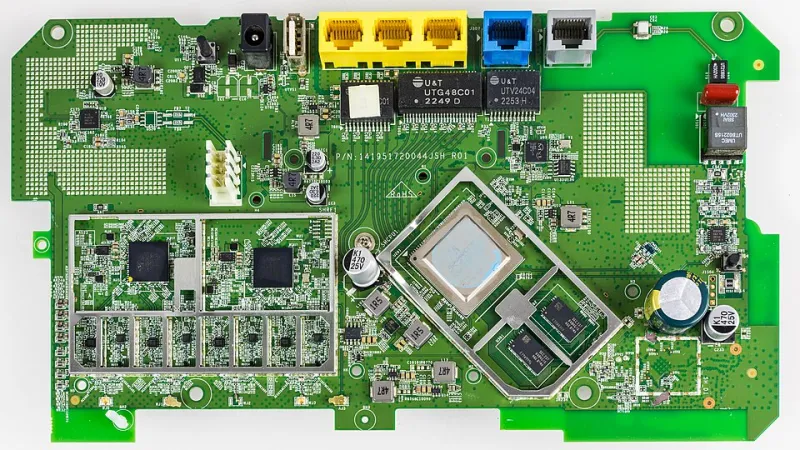
Photo: Raimond Spekking, CC BY-SA 4.0, via Wikimedia Commons
There is a particular irony embedded in the phrase "smart home." The more intelligent a household becomes — the more sensors it deploys, the more assistants it activates, the more chargers it plants across every flat surface — the less efficiently it tends to use electricity. The devices that promise convenience are, in many cases, running continuous low-level draws on the grid around the clock, whether or not anyone is home, awake, or paying attention.
This phenomenon has a name: phantom load, sometimes called standby power or vampire power. And while a single smart speaker drawing 2 watts at rest may seem inconsequential, the aggregate picture at the national level is anything but trivial.
What the Numbers Actually Say
The Lawrence Berkeley National Laboratory has estimated that standby power accounts for approximately 5 to 10 percent of residential electricity consumption in the United States. At scale, that translates to roughly $19 billion in annual energy costs across American households — power consumed not in the act of doing anything useful, but simply in the state of waiting.
The devices most responsible for this drain are not necessarily the ones consumers would guess. While televisions and gaming consoles are well-known offenders, the newer generation of always-connected smart home hardware has introduced a more distributed and harder-to-quantify problem. A Z-Wave hub, a mesh Wi-Fi node, a video doorbell base station, a wireless charging pad with no device on it — each contributes a modest but persistent draw. Multiply that by the 16.7 smart home devices that research firm Parks Associates estimates the average U.S. broadband household now operates, and the standby load profile becomes substantial.
The Measurement Problem
One reason phantom loads remain underaddressed is that they are genuinely difficult to perceive without dedicated instrumentation. A utility bill presents a single aggregate figure. It does not distinguish between the kilowatt-hours consumed by the refrigerator doing legitimate work and those consumed by a router that hasn't been rebooted in three years.
The most accessible entry point for consumers is a plug-level power meter. Devices such as the Kill A Watt P4400 — available for under $30 at most hardware retailers — allow users to measure real-time wattage, accumulated kilowatt-hours, and estimated annual cost for any device plugged into a standard outlet. The methodology is straightforward: plug the meter between the outlet and the device, leave it connected for 24 hours in the device's typical standby state, and record the result.
For a more comprehensive household audit, smart plugs with integrated energy monitoring — products from Kasa, Emporia, or Shelly are commonly used in the U.S. market — can log consumption data continuously and surface it through mobile dashboards. This approach is particularly useful for identifying devices whose standby behavior fluctuates, such as smart TVs that periodically wake to download firmware updates or gaming consoles that maintain network presence for multiplayer readiness.
Building Your Household Load Map
A structured audit begins with inventory. Walk through each room and catalog every device that remains plugged in when not in active use. Pay particular attention to the following categories, which consistently register the highest standby consumption in residential settings:
Wireless charging infrastructure. Multi-device charging stations — the kind designed to simultaneously accommodate a smartphone, smartwatch, and earbuds — frequently draw 3 to 8 watts continuously, regardless of whether any device is docked. Over the course of a year, a single unoccupied charging station can consume 26 to 70 kilowatt-hours.
Streaming and entertainment hardware. Set-top boxes and streaming sticks vary widely. A Roku stick in standby draws under 1 watt; certain cable company-issued DVRs have been measured drawing 15 to 20 watts in standby, a figure that approaches active operation for many devices.
Smart home hubs and bridges. Devices that serve as protocol translators — Zigbee coordinators, Lutron bridges, SmartThings hubs — operate continuously by design. Their individual draws are modest, typically 2 to 5 watts, but they never enter a meaningful low-power state.
Networking equipment. A home router and modem combination drawing 12 to 18 watts is essentially a small but persistent load that runs every hour of every day. Over a year, that amounts to 105 to 158 kilowatt-hours — more than some chest freezers consume in operation.
Once individual device readings are collected, a simple spreadsheet can aggregate annual kilowatt-hour estimates and apply the household's average electricity rate (the U.S. residential average sits near $0.16 per kilowatt-hour as of recent EIA data) to produce a concrete dollar figure for phantom load.
Practical Reduction Strategies
Measurement without action is merely data. Once the audit is complete, several intervention strategies offer meaningful results without requiring the wholesale removal of smart home infrastructure.
Switchable power strips allow groups of entertainment or office devices to be fully de-energized with a single action. This is particularly effective for home theater setups where multiple devices maintain standby states in parallel. Advanced models with occupancy sensing or scheduling capabilities can automate the cutoff based on time-of-day or room vacancy.
For wireless charging stations, a simple mechanical outlet timer — set to activate only during the hours when charging is actually needed — eliminates the idle draw entirely during overnight hours or workdays.
Routers and networking equipment present a more complex tradeoff, since powering them down disrupts connectivity for any device that may need it. However, households with consistent schedules may find that scheduling a nightly reboot (which most modern routers support natively) achieves modest savings while also improving device performance.
Why This Metric Matters Beyond the Household
The individual savings from a thorough phantom load audit may range from $50 to $200 annually for a well-equipped smart home — meaningful, but perhaps not transformative on its own. The broader significance lies in the aggregate. If the 128 million U.S. households each reduced standby consumption by even 10 percent, the collective impact on grid demand would be measurable at the regional level, particularly during the shoulder hours of early morning when standby loads represent a disproportionate share of total residential draw.
For readers who track energy metrics professionally or analytically, phantom load is also a useful proxy for the broader challenge of measuring invisible infrastructure costs — a principle that extends well beyond the home and into the data centers, network nodes, and always-on platforms that define the modern digital economy. The methodology is the same: instrument the system, collect the data, and let the numbers speak.
The wattage is there. It simply requires the right meter to see it.