Algorithmic Load: The Measurable Connection Between Your Notification Feed and the Power Grid
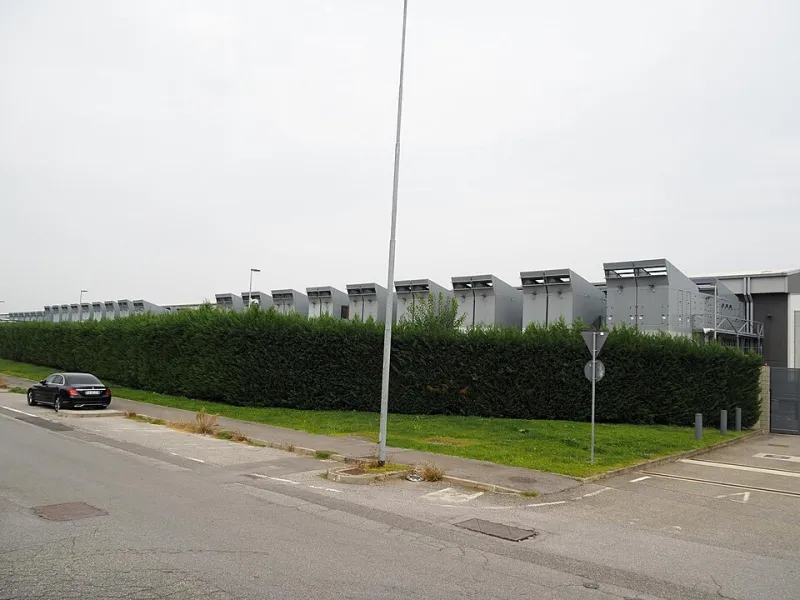
Photo: Acabashi, CC BY-SA 4.0, via Wikimedia Commons
At 7:14 p.m. on a Tuesday evening in Chicago, a push notification arrives on millions of smartphones simultaneously. The content is algorithmically selected — a trending video, a breaking news alert, a friend's activity flag. The action is invisible in any individual sense. But aggregated across a platform with hundreds of millions of active US users, that coordinated moment of digital engagement represents a measurable pulse of electrical demand. It runs through device batteries, home Wi-Fi routers, residential broadband infrastructure, regional internet exchange points, and ultimately back to the data centers processing every interaction in near real time.
This is not a coincidence. It is, increasingly, a design pattern — and its implications for grid stability deserve the same analytical rigor applied to any other category of industrial load.
Mapping the Engagement Spike
To understand the relationship between platform behavior and power consumption, it helps to start with what is known about engagement timing. Social media platforms publish relatively little about their internal scheduling logic, but behavioral data and third-party analytics paint a consistent picture. In the United States, peak engagement windows on major platforms — including Instagram, TikTok, YouTube, and Facebook — cluster reliably in the late afternoon and early evening, typically between 6:00 p.m. and 9:00 p.m. local time across time zones.
This window is not arbitrary. It aligns with the period when American consumers are transitioning from work to leisure, when smartphone screen time is at its daily maximum, and when platforms compete most aggressively for attention share. It also, critically, aligns with the evening peak demand period recognized by every regional transmission organization in the continental United States.
The Lawrence Berkeley National Laboratory has documented the energy intensity of consumer internet activity at various levels of the network stack. Streaming a high-definition video for one hour consumes approximately 0.036 to 0.24 kilowatt-hours depending on the device and network path. Multiplied across tens of millions of simultaneous sessions triggered by algorithmic content pushes, the aggregate demand signal becomes meaningful — not catastrophic in isolation, but material when layered onto an already-stressed evening grid.
The Notification Architecture
Platform notification systems are not simple message queues. They are sophisticated delivery engines optimized for engagement probability, informed by individual behavioral models that predict when a given user is most likely to respond to a given type of content. This optimization, however, operates primarily at the individual level. The system is not designed to smooth aggregate demand — it is designed to maximize aggregate engagement. The result is a natural tendency toward synchronization.
When a platform's model determines that 6:30 p.m. to 7:30 p.m. is the highest-conversion notification window for a broad segment of its US user base, it routes a disproportionate share of its notification volume into that window. Individual users experience this as their phone becoming more active in the early evening. Grid operators experience it as a diffuse but real increment of residential and network demand.
Algorithm update cycles compound this effect. When platforms deploy major changes to their content ranking or recommendation systems — events that typically occur without public announcement — the resulting shifts in content surfacing can produce sharp, short-duration spikes in engagement that have no precedent in the platform's historical load profile. For data centers serving those platforms, these events translate directly into abrupt increases in compute demand.
"Unplanned load spikes are the scenario that keeps grid operators awake," noted a power systems engineer with experience at a Midwestern independent system operator, speaking in general terms about demand variability. "It doesn't matter whether the source is an industrial facility or a digital platform. If the ramp rate exceeds what the generation fleet can respond to, you have a reliability problem."
Quantifying Your Digital Footprint
For individual readers, the connection between personal engagement habits and grid-level power consumption may seem too diffuse to measure meaningfully. In practice, however, the tools to conduct a basic audit already exist — and the exercise is more illuminating than it might appear.
Begin with device-level consumption. Most modern smartphones expose battery usage statistics broken down by application. A user who spends three hours on video-heavy social media applications during peak evening hours is drawing a sustained load from their device that, while small in absolute terms, is occurring simultaneously with millions of equivalent sessions. The aggregate is the point.
Next, consider the network path. Home broadband routers consume between 6 and 20 watts continuously. Streaming-heavy evening use does not dramatically alter router consumption, but it does increase the utilization of upstream network infrastructure — cable head-ends, fiber aggregation nodes, and regional data centers — all of which draw from the grid.
Several third-party tools now provide estimates of the carbon and energy intensity of internet activity. The Shift Project's 1byte model and the Green Web Foundation's carbon estimation API both offer methodologies for translating data transfer volumes into approximate energy equivalents. While these models carry acknowledged uncertainty, they provide a useful order-of-magnitude framework.
A practical audit workflow: log your application screen time for a one-week period, noting the distribution of usage across morning, midday, and evening windows. Identify the applications generating the most notification-driven engagement sessions — the ones pulling you back to the screen during peak hours. Then consider whether that engagement timing is genuinely your preference or whether it reflects a platform-optimized default.
The Structural Incentive Problem
Platforms have little direct financial incentive to smooth their demand profiles. Their data center energy costs, while substantial, are largely fixed or pass-through expenses. The grid costs associated with serving peak demand — the peaker plants that run only during high-load hours, the transmission upgrades built to handle maximum coincident load — are borne by utility ratepayers, not by the platforms generating the demand signal.
This structural disconnect is precisely the kind of misalignment that energy economists flag as a source of inefficiency. When the entity creating a cost does not bear that cost, the usual market signals for behavior change are absent.
Some researchers have proposed demand-response frameworks specifically designed for large digital platforms — mechanisms that would compensate platforms for voluntarily shifting compute-intensive operations, such as model training runs and large-scale data processing jobs, to off-peak hours. These proposals remain largely theoretical in the US regulatory context, though similar concepts have been explored in European grid planning discussions.
Reading the Right Metrics
For technically minded readers, the actionable insight here is not that social media is uniquely villainous in the grid demand picture — it is that the metrics used to describe both platform behavior and grid load are often too coarse to reveal the relationship between them. Engagement rates, daily active users, and monthly peak demand figures all obscure the sub-hourly dynamics where the real interaction occurs.
The metrics worth tracking are narrower and more specific: notification delivery volume by hour, content push frequency during utility-defined peak periods, and the correlation between major platform algorithm deployments and short-duration demand anomalies in regional grid data. Some of this information is publicly available through ISO/RTO load data portals. Some requires platform transparency that does not currently exist.
Until those disclosures are available, the relationship between your evening scroll and the grid serving it will remain measurable in principle — and largely unmeasured in practice. That gap is itself a data point worth noting.