The Final Five: Why Topping Off Your Phone Costs More Grid Energy Than You Think
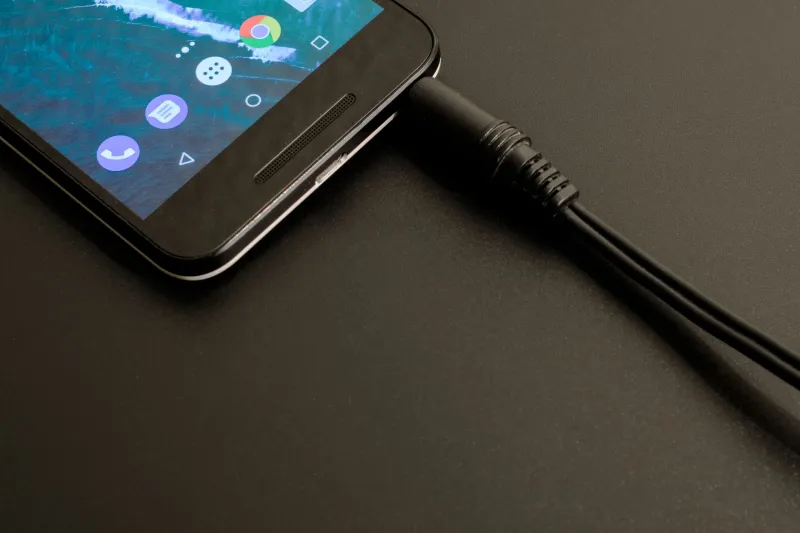
There is a number on your phone screen right now that you almost certainly trust. The battery percentage indicator feels precise—clinical, even. It counts down in clean increments and back up again when you plug in. What it does not tell you is how much electricity the grid had to surrender to move that number by a single digit, nor how dramatically that cost changes depending on where in the charging cycle you happen to be.
The assumption embedded in most consumer behavior is straightforward: a 1% charge is a 1% charge. Topping off from 95% to 100% should cost roughly the same as recovering from 45% to 50%. That assumption is wrong, and the gap between perception and measurement has real consequences—not just for individual utility bills, but for aggregate grid demand across hundreds of millions of devices operating simultaneously across the United States.
The Chemistry Behind the Curve
Modern smartphones rely on lithium-ion or lithium-polymer cells, both of which follow a charging profile that is anything but linear. During the bulk of a charge cycle—roughly from 20% to 80% of stated capacity—chargers operate in what engineers call constant-current mode. The voltage climbs steadily, current flows at or near its rated maximum, and the battery accepts energy efficiently. This is the phase where charging feels fast because it genuinely is.
Once the battery approaches its upper voltage threshold, the charger transitions to constant-voltage mode. To prevent thermal runaway and preserve long-term cell health, the charging current is progressively throttled. The battery is still accepting electrons, but at a fraction of the earlier rate. The charger, meanwhile, continues drawing from the wall at levels that do not scale proportionally downward. The result is a widening gap between energy consumed from the grid and energy actually stored in the cell.
This inefficiency is not a design flaw—it is a deliberate safety and longevity trade-off. But it carries a measurable cost that percentage indicators were never designed to communicate.
Measuring What the Screen Won't Show
Ampergram's review of published power measurement studies and third-party charging analyses across a range of popular smartphone models—including flagship devices from Apple, Samsung, and Google—reveals a consistent pattern. Charging efficiency across the 20%–80% band routinely falls between 85% and 92%, depending on charger quality and cable resistance. Charge that same device from 80% to 100%, and efficiency figures frequently drop into the 65%–75% range for the final increment.
Translated into absolute numbers: moving a typical 4,500 mAh battery from 95% to 100% may require the grid to deliver 30% to 50% more energy per percentage point than it delivered during the middle portion of the same cycle. The percentage indicator advances by one. The meter behind your wall moves by considerably more than one-fifth of what it moved during a comparable increment hours earlier.
Charger hardware compounds this dynamic. Higher-quality GaN (gallium nitride) chargers maintain better efficiency curves across the transition to constant-voltage mode. Older resistive chargers and low-cost third-party adapters perform noticeably worse, bleeding additional energy as heat. In a nation where tens of millions of households are still using the chargers that shipped with devices purchased years ago, this hardware variance is not trivial.
Standby Draw: The Tax That Never Stops
Even before the battery reaches 100%, a second inefficiency layer activates that most consumers never consider: charger standby consumption. Once a battery is fully charged, a properly functioning charger does not simply stop drawing power. It enters a maintenance or trickle state, continuing to monitor cell voltage and compensate for the microscopic self-discharge that all lithium cells experience.
For a device left plugged in overnight—a behavior that describes the majority of American smartphone users according to consumer habit surveys—this standby draw can persist for six to eight hours following the completion of the actual charge cycle. Individual standby consumption figures are modest, typically ranging from 0.1W to 0.5W depending on charger design. Multiplied across an estimated 270 million active smartphone users in the United States, a significant fraction of whom leave devices charging through the night, the aggregate standby load becomes a measurable baseline contribution to overnight grid demand.
This is precisely the kind of distributed, invisible load that aggregate grid analytics struggle to isolate—small per device, enormous in aggregate, and entirely absent from the mental model most consumers apply when they plug in before bed.
The 80% Argument, Quantified
The smartphone industry has quietly acknowledged the charging curve problem through software. Apple's Optimized Battery Charging feature, Google's Adaptive Charging on Pixel devices, and similar implementations from Samsung deliberately pause charging at 80% and resume only in time for a user's typical wake-up window. The stated rationale focuses on battery longevity—keeping cells out of the high-voltage range for extended periods demonstrably reduces degradation. But the grid-efficiency argument is equally valid and far less frequently discussed.
A device that charges to 80% and holds there consumes meaningfully less grid energy than one that pushes to 100% and maintains that level. The difference in usable capacity for most daily use cases is marginal—modern flagships carry enough capacity that the 20% gap rarely matters in practice. The difference in grid energy consumed over thousands of charge cycles, however, is not marginal at all.
If the 270 million smartphone users in the United States collectively adopted an 80% charging ceiling—even as a default rather than a universal mandate—the reduction in charging-phase inefficiency losses and overnight standby consumption would represent a load reduction measurable at the regional grid level. It would not solve America's energy challenges. But it would register on the instruments that track them.
What the Percentage Indicator Owes You
The battery percentage display was designed as a fuel gauge, not an energy accounting tool. It tells you how much stored capacity remains available to power your applications. It was never engineered to communicate grid-side efficiency, charger conversion losses, or standby consumption patterns. That gap between what the indicator measures and what the meter measures is where a significant quantity of wasted electricity quietly lives.
For technically engaged consumers, the practical takeaway is straightforward: the cost of that final charge increment is not zero, and the assumption that 100% is meaningfully better than 80% for daily use is worth scrutinizing. For grid planners and utility analysts, the more important insight may be structural—hundreds of millions of devices optimized for user convenience rather than system efficiency represent a persistent, distributed inefficiency that aggregate demand forecasting models have historically underweighted.
The percentage on your screen is accurate as far as it goes. The question worth asking is how far that actually is.