Perpetual Handshake: The Measurable Power Cost of Always-On Device Synchronization
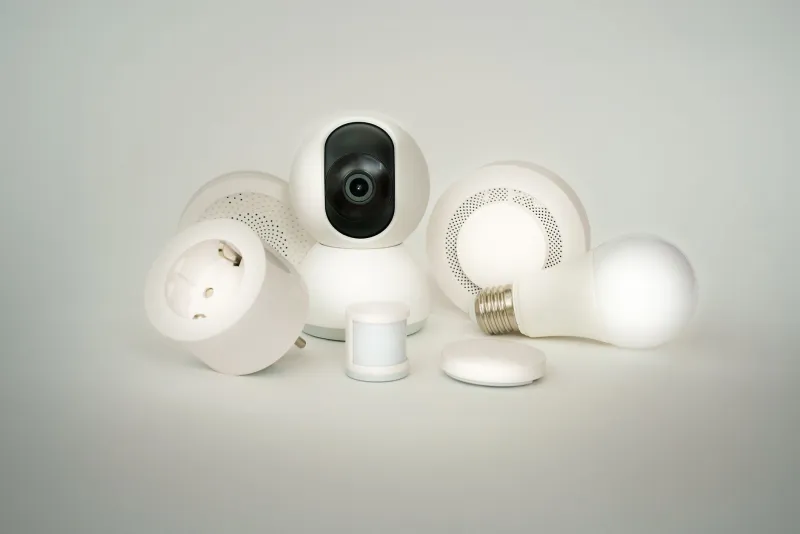
At any given moment inside a moderately equipped American smart home, a quiet negotiation is underway. A smartwatch confirms its time against a network server. A thermostat registers a door sensor's state change. A security camera logs a motion timestamp to a cloud endpoint. A smart speaker polls for a firmware delta. None of these exchanges last more than a fraction of a second. None draw more than a few milliwatts in isolation. Yet they never stop—and when aggregated across the roughly 63 million smart home device installations currently active in the United States, the cumulative electrical signature is neither trivial nor well understood.
This is the synchronization tax: a distributed, persistent baseline load generated not by active device use, but by the continuous overhead of keeping interconnected systems in agreement about time, state, and identity.
What Synchronization Actually Requires
To appreciate the electrical dimensions of device synchronization, it helps to understand what the process demands at the hardware level. Most consumer smart devices rely on one or more of three primary sync mechanisms: Network Time Protocol (NTP), cloud-state polling, and mesh-network heartbeats.
NTP synchronization, which keeps device clocks accurate to within milliseconds, typically requires a device to wake its wireless radio, transmit a small UDP packet, receive a response, and update an internal register. The radio wake cycle alone can consume between 50 and 200 milliwatts for the duration of the exchange—usually under 100 milliseconds. Devices performing NTP sync every 15 to 30 minutes impose a power profile that is easily dismissed as negligible on a per-device basis.
Cloud-state polling is more variable and often more expensive. Smart thermostats, lighting systems, and security platforms frequently ping their respective cloud backends at intervals ranging from a few seconds to several minutes, confirming that local states match server records. Depending on the protocol—MQTT, HTTPS, or proprietary—each poll may involve a full TCP handshake, SSL negotiation, and payload transfer. Measured in isolation, this process can consume anywhere from 10 to 150 milliwatts per exchange. Measured across a device that polls every 30 seconds throughout a 24-hour period, the cumulative energy draw becomes a meaningful line item on a home's consumption ledger.
Mesh-network heartbeats, common in Zigbee, Z-Wave, and Thread ecosystems, represent a third category. Devices in these networks continuously broadcast presence signals to maintain routing tables and confirm node availability. Unlike Wi-Fi-based communications, mesh heartbeats are typically low-power by design—but they are also far more frequent, sometimes occurring multiple times per minute.
Building a Household Power Profile
Consider a representative American household equipped with a mid-tier smart home configuration: one smart thermostat, four smart plugs, a video doorbell, two indoor cameras, six smart light switches, a smart lock, and a connected smoke detector—alongside personal devices including two smartphones, a smartwatch, and a laptop. This is not an extravagant setup; it reflects the median profile of households that have adopted smart home technology incrementally over the past five years.
Applying conservative power estimates to the synchronization activity of each device category, a rough baseline emerges. The thermostat's cloud polling may contribute an effective continuous draw of 0.3 to 0.5 watts attributable purely to sync overhead—distinct from its display, sensor, and control functions. The four smart plugs, operating on a Zigbee mesh, each contribute approximately 0.1 watts in heartbeat transmission. The two cameras, which must maintain persistent cloud connections to support real-time alert delivery, carry synchronization overhead estimated between 0.4 and 0.8 watts per unit. The smart lock, which polls for remote command updates, adds another 0.2 watts.
Aggregating these estimates—conservatively—yields a synchronization-specific baseline load of approximately 3 to 5 watts for this household configuration. That figure may appear modest until it is considered in context: it operates continuously, 8,760 hours per year, regardless of whether any device is actively being used. At the US average retail electricity price of approximately 16 cents per kilowatt-hour, this translates to between $4.20 and $7.00 annually per household in synchronization overhead alone.
The Grid-Scale Arithmetic
Individual household figures rarely command attention in grid planning discussions. The calculus changes when applied at scale. If 30 million US households maintain a synchronization baseline of even 3 watts—a conservative floor for moderately connected homes—the aggregate continuous load approaches 90 megawatts. That is the rough equivalent of a small peaker plant operating at full capacity, around the clock, to do nothing other than keep devices informed of each other's states.
The more significant grid concern, however, may not be the steady-state load but rather the synchronization surge. Many cloud platforms perform scheduled bulk-sync operations during off-peak hours, typically between midnight and 6:00 a.m., when firmware updates, database reconciliations, and device certificate renewals are pushed simultaneously to large device populations. A coordinated sync event across millions of devices—each briefly spiking its radio and processor—can produce a measurable demand pulse on regional distribution networks. Utilities in states with high smart home penetration, including California, Texas, and Washington, have documented overnight demand irregularities that do not conform to traditional residential load models.
Efficiency Gaps in Current Protocol Design
The engineering community has not ignored synchronization efficiency entirely. Thread, the networking protocol backed by the Connectivity Standards Alliance and adopted by Apple, Google, and Amazon, was designed with low-power mesh operation as a core objective. Its border router architecture reduces the frequency with which individual end nodes must communicate with cloud infrastructure, consolidating sync traffic through a single gateway device.
Nevertheless, most of the smart home devices currently installed in American homes predate Thread's broad adoption and operate on older, less power-conscious protocols. Firmware updates can improve polling intervals and reduce unnecessary wake cycles, but manufacturers have limited commercial incentive to prioritize synchronization efficiency in devices that have already been sold. The result is a large installed base of devices operating on energy profiles that were never optimized for aggregate grid impact.
Some utilities have begun exploring demand-response frameworks that could coordinate synchronization schedules across device populations—essentially staggering the timing of bulk sync events to flatten overnight demand curves. These programs remain nascent, and their implementation requires cooperation between utilities, platform operators, and device manufacturers that has historically been difficult to sustain.
Measuring What Is Easy to Ignore
The synchronization tax does not appear as a discrete line item on any electricity bill. It is embedded within the baseline consumption figures that most households never scrutinize. Whole-home energy monitors—devices such as the Sense Energy Monitor or Emporia Vue—can capture the aggregate effect, but attributing specific wattage to synchronization overhead requires protocol-level logging that consumer tools do not currently provide.
For technical users, router-level traffic analysis tools can expose the frequency and volume of sync communications, offering a proxy measure of synchronization activity even without direct power metering. Platforms that support local processing—running home automation logic on a local server rather than routing every state change through a cloud endpoint—consistently demonstrate lower synchronization-related power profiles, a measurable advantage that is rarely factored into purchasing decisions.
The convenience of seamless, always-current device coordination is real and, for many households, genuinely valuable. But that convenience carries an electrical cost that is distributed, persistent, and growing as device counts rise. Quantifying it is the first step toward managing it—and in aggregate, the numbers are large enough to matter.