Silent Cycles: The Cumulative Grid Cost of Background App Synchronization Across America's Device Ecosystem
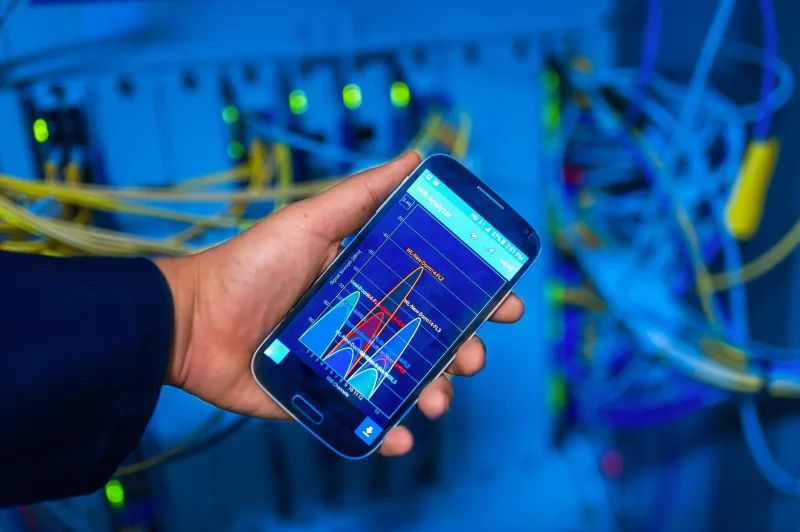
The power consumption of a single smartphone refreshing its email in the background is negligible by any reasonable measure — a fraction of a watt, sustained for a fraction of a second. Multiply that event by 270 million active smartphone users in the United States, each running a dozen or more applications with background refresh enabled, and the arithmetic shifts considerably. What emerges is not a trivial footnote in residential energy accounting but a diffuse, continuous, and poorly understood load layer that utility forecasters have yet to adequately model.
At Ampergram, we follow the metrics that matter. And increasingly, the metrics that matter are the ones no one is measuring.
Defining the Draw: What Background Refresh Actually Does
Background app refresh is a feature present on virtually every modern mobile operating system. On iOS, it allows applications to fetch new content, update location data, and process push notifications even when the user is not actively engaging with the app. Android implements a functionally similar architecture through its background services and job scheduling APIs. Wearables — smartwatches, fitness trackers, wireless earbuds with companion apps — add another synchronization layer, frequently communicating with a paired phone every few seconds.
Each of these events carries a power cost. The device's radio hardware — whether Wi-Fi, Bluetooth, or cellular — must power up, establish a connection, transmit or receive data, and return to a lower-power state. This wake cycle, often called a "radio wake lock" in developer documentation, is energy-intensive relative to the idle baseline. Estimates from battery optimization research suggest that a single background fetch event on a cellular connection can consume anywhere from 5 to 15 milliwatt-hours, depending on signal strength, data payload size, and network protocol efficiency.
That figure sounds small. The scale does not.
Running the Numbers: From Milliwatts to Megawatts
Consider a conservative scenario. Assume 200 million smartphones in active daily use across the US, each executing an average of 60 background sync events per hour across all installed applications. At a midpoint energy cost of 10 milliwatt-hours per event, the arithmetic produces approximately 120 megawatt-hours of consumption per hour — or a sustained load of roughly 120 megawatts, continuously, around the clock.
For context, 120 megawatts is sufficient to power a small city. It represents the output of a modest natural gas peaker plant. And critically, it is a load that does not appear as a discrete, identifiable signal on any utility dashboard. It is distributed across millions of endpoints, arriving at the grid through residential meters, commercial Wi-Fi infrastructure, and cellular tower backhaul — invisible in aggregate because no single device draws enough to register.
When wearables and tablets are included in the calculation, that figure grows. The average US household now contains more than ten connected devices. Many of those devices are synchronizing continuously, often redundantly — a smartwatch pulling the same weather update that a phone already retrieved thirty seconds earlier.
The Forecasting Gap: Why Utilities Are Flying Partially Blind
Traditional utility load forecasting relies on identifiable consumption signatures: HVAC cycles, water heater schedules, industrial shift changes, major appliance runtimes. These loads have known shapes — predictable ramp rates, duration profiles, and seasonal modifiers. Background synchronization has none of these characteristics. It is asynchronous, device-agnostic, and largely immune to the behavioral patterns that forecasters depend upon.
The problem is compounded by the fact that synchronization activity often correlates with periods of high social engagement. When a major news event breaks, a sports result is announced, or a viral content cycle peaks on social platforms, background refresh rates across the installed device base increase simultaneously. Applications poll their servers more frequently. Push notification systems generate cascading radio wake events. The result is a soft demand spike — not sharp enough to appear as a traditional peak, but real enough to affect grid margin calculations if it occurs during an already-stressed period.
Some regional transmission organizations have begun incorporating diffuse device load estimates into their planning models, but the granularity remains limited. The data required to accurately forecast synchronization-driven demand — app-level activity rates, radio wake frequency by device type, geographic device density — largely resides with platform operators, not utilities. That information asymmetry is a structural problem with no near-term resolution in sight.
The Consumer Dimension: What Individual Settings Actually Control
For the individual user, background app refresh settings represent one of the few direct levers available to reduce this category of consumption. On iOS, disabling background refresh for non-essential applications — social media clients, shopping apps, news aggregators — can meaningfully reduce radio wake frequency. Android users have access to battery optimization settings that restrict background activity for selected apps, and more aggressive options exist through developer settings for those willing to engage with them.
The energy savings at the device level are modest in absolute terms. A user who aggressively restricts background activity across all non-essential apps might extend battery life by 10 to 20 percent, which translates to reduced charging frequency and, over time, a marginally lower residential electricity draw. For an individual household, the annual savings might amount to a few kilowatt-hours — not a number that appears meaningfully on a monthly bill.
But the aggregate story is different. If even 20 percent of US smartphone users reduced their background sync activity by half, the resulting load reduction across the device ecosystem would be measurable at the regional grid level. In states with high device density and constrained grid capacity — California, Texas during summer demand peaks — that reduction could carry real operational value during critical hours.
A Metric Without a Meter
The deeper issue raised by background synchronization demand is epistemological: the electricity system was designed to measure and manage loads that have physical presence and identifiable location. A refrigerator compressor, a commercial HVAC unit, an electric vehicle charger — these are loads that exist at a point in space, draw current through a metered connection, and produce a legible signal. Background app refresh produces no such signal. It is a load defined entirely by software behavior, distributed across a device ecosystem that utilities have no direct visibility into.
This is the emerging challenge of the software-defined grid era. As more electricity consumption becomes a function of application logic rather than physical hardware operation, the traditional tools of demand forecasting become progressively less adequate. The industry will eventually require new data-sharing frameworks — likely involving platform operators, device manufacturers, and grid operators — to account for these invisible loads with the precision that reliable grid management demands.
Until those frameworks exist, background synchronization will remain what it is today: a real, measurable, and entirely unaccounted contribution to the electricity demand of the United States. The current flows whether or not anyone is watching the meter.